Table of Differences in Means Tests / Tabla de Tests de Diferencias de Medias
español
In this post I leave you a simple Stata code that generates a table of means differences (between 2 groups) for a set of variables. It looks like this:
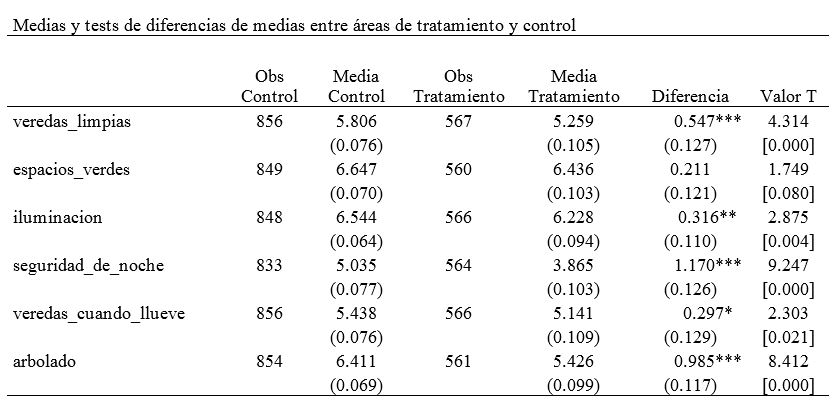 A table of this type will be useful, for example, when the aim is to compare a treatment group and a control group across a series of variables.
Stata has the ttest command to perform tests of this kind, but does not incorporate, as far as I know, a functionality for exporting a table of multiple tests.
This code tests a large number of variables, with the advantage that it generates and exports a publication-style table. The table is saved in a text (.txt) file. Then, I usually import this table into Excel (insert> data> text) for final retouching before copying it to the final document. I leave you the Excel template as well. For simplicity, asterisks for significant statistics, parentheses and brackets are added - also automatically - by the Excel template.
From the statistical point of view, it might be worth mentioning the subject of false-discovery rates, which could be relevant in an application of this type. I will leave it for for a future post.
You can test the code with this database, which contains the results of a survey for two groups (one “treatment” and one “control”) of individuals on urban attributes’ quality .
If you find it useful, or for comments and suggestions please leave me a comment!
[sourcecode language=“text” firstline=“1” highlight=“1,3,5,7” padlinenumbers=“false”]
*Define folder for text file output
cd “C:\Users\Ricardo Pasquini\Documents\otros”
* A global macro handles the names of the multiple variables
global TTESTVARS “veredalimpia_nota verdes_nota ilum_nota nocheseg_nota veredallovio_nota arbol_nota ordentrans”
* You can also specify labels. Be shure of keeping word connected by underlines
global TTESTLABELS “veredas_limpias espacios_verdes iluminacion seguridad_de_noche veredas_cuando_llueve arbolado orden_transito”
* Define here the name of the binary variable that signals the two groups. In this case is called “intervencion”
gen groups=intervencion
sum $TTESTVARS
/* Define el nombre de la tabla*/
capture: erase descstats.txt
file open fh using descstats.txt, write replace
file write fh _n _tab “Difference in Means Test”
file write fh _n _tab “Variable” _tab “Obs Control” _tab “Media Control” _tab “Obs Tratamiento” _tab “Mean Treatment” _tab “Diff” _tab “t”
local i=1
foreach var of global TTESTVARS {
local etiqueta : word
A table of this type will be useful, for example, when the aim is to compare a treatment group and a control group across a series of variables.
Stata has the ttest command to perform tests of this kind, but does not incorporate, as far as I know, a functionality for exporting a table of multiple tests.
This code tests a large number of variables, with the advantage that it generates and exports a publication-style table. The table is saved in a text (.txt) file. Then, I usually import this table into Excel (insert> data> text) for final retouching before copying it to the final document. I leave you the Excel template as well. For simplicity, asterisks for significant statistics, parentheses and brackets are added - also automatically - by the Excel template.
From the statistical point of view, it might be worth mentioning the subject of false-discovery rates, which could be relevant in an application of this type. I will leave it for for a future post.
You can test the code with this database, which contains the results of a survey for two groups (one “treatment” and one “control”) of individuals on urban attributes’ quality .
If you find it useful, or for comments and suggestions please leave me a comment!
[sourcecode language=“text” firstline=“1” highlight=“1,3,5,7” padlinenumbers=“false”]
*Define folder for text file output
cd “C:\Users\Ricardo Pasquini\Documents\otros”
* A global macro handles the names of the multiple variables
global TTESTVARS “veredalimpia_nota verdes_nota ilum_nota nocheseg_nota veredallovio_nota arbol_nota ordentrans”
* You can also specify labels. Be shure of keeping word connected by underlines
global TTESTLABELS “veredas_limpias espacios_verdes iluminacion seguridad_de_noche veredas_cuando_llueve arbolado orden_transito”
* Define here the name of the binary variable that signals the two groups. In this case is called “intervencion”
gen groups=intervencion
sum $TTESTVARS
/* Define el nombre de la tabla*/
capture: erase descstats.txt
file open fh using descstats.txt, write replace
file write fh _n _tab “Difference in Means Test”
file write fh _n _tab “Variable” _tab “Obs Control” _tab “Media Control” _tab “Obs Tratamiento” _tab “Mean Treatment” _tab “Diff” _tab “t”
local i=1
foreach var of global TTESTVARS {
local etiqueta : word i' of $TTESTLABELS capture quietly ttest var’, by(groups)
local se_1 = (r(sd_1))/(r(N_1))^0.5
local se_2 = (r(sd_2))/(r(N_2))^0.5
local dif =(r(mu_1)-r(mu_2))
file write fh _n _tab “etiqueta'" \_tab %12.0fc (r(N\_1)) \_tab %12.3fc (r(mu\_1)) \_tab %12.0fc (r(N\_2)) \_tab %12.3fc (r(mu\_2)) \_tab %12.3fc (dif’) _tab %12.3fc (r(t))
file write fh _n _tab _tab _tab %12.3fc (se\_1') \_tab \_tab %12.3fc (se_2’) _tab %12.3fc (r(se)) _tab %12.3fc (r(p))
local i=i'+1 } file close fh type descstats.txt [/sourcecode] En este post les dejo un simple código en Stata que genera una tabla de diferencias de medias (entre 2 grupos) para un conjunto de variables. Se verá así: [](https://ricardopasquini.com/2017/03/25/table-of-differences-in-means-tests-tabla-de-tests-de-diferencias-de-medias/captura/) Armar una tabla de este tipo será útil, por ejemplo, cuando donde deseamos comparar un conjunto de variables entre un grupo tratamiento y un grupo de control. Stata posee el comando ttest para realizar tests de este tipo, pero no incorpora, hasta donde conozco, una funcionalidad para múltiples tests. Este código realiza los tests sobre una gran cantidad de variables, genera y exporta una tabla similar a las que encontramos en una publicación. La tabla queda guardada en un archivo.txt. Luego, suelo importar esta tabla al Excel (insert>data>text) para retoques finales antes de llevarla al documento final. Les dejo [este archivo](https://www.dropbox.com/s/qs0nm4umvmb7lsd/ttest%20table%20template.xlsx?dl=0) a modo de template también. Por simplicidad, los asteriscos que muestran significatividad estadística, paréntesis y corchetes son añadidos -también automáticamente- en el segundo paso en Excel. No voy a entrar aquí en el tema de [false-discovery rates](https://en.wikipedia.org/wiki/False_discovery_rate), que podría ser relevante en una aplicación de este tipo. Queda para un futuro post. Pueden probar el código con [esta base](https://www.dropbox.com/s/rrmqokvnpdpleag/calidad_ratings.dta?dl=0), que contiene los resultados de una encuesta sobre calidad de atributos urbanos para dos grupos (uno "tratamiento" y uno "control"). Si les resultó útil, o por comentario o sugerencias por favor dejen un comentario! [sourcecode language="text" firstline="1" highlight="1,3,5,7" padlinenumbers="false"] \*Definir la carpeta donde se guardará la tabla cd "C:\Users\Ricardo Pasquini\Documents\otros" \* Un global guarda los nombres de las variables a testear global TTESTVARS "veredalimpia\_nota verdes\_nota ilum\_nota nocheseg\_nota veredallovio\_nota arbol\_nota ordentrans" \* Definimos aqui una etiqueta para cada variable. Las etiquetas apareceran en la tabla en vez de los nombres de las variables global TTESTLABELS "veredas\_limpias espacios\_verdes iluminacion seguridad\_de\_noche veredas\_cuando\_llueve arbolado orden\_transito" \* Definir aqui el nombre de la variable binaria que separa a los dos grupos. En este ejemplo es "intervencion" gen groups=intervencion sum $TTESTVARS /\* Define el nombre de la tabla\*/ capture: erase descstats.txt file open fh using descstats.txt, write replace file write fh \_n \_tab "Tests de Diferencias de Medias" file write fh \_n \_tab "Variable" \_tab "Obs Control" \_tab "Media Control" \_tab "Obs Tratamiento" \_tab "Media Tratamiento" \_tab "Diff" \_tab "t" local i=1 foreach var of global TTESTVARS { local etiqueta : word i’ of $TTESTLABELS
capture quietly ttest var', by(groups) local se\_1 = (r(sd\_1))/(r(N\_1))^0.5 local se\_2 = (r(sd\_2))/(r(N\_2))^0.5 local dif =(r(mu\_1)-r(mu\_2)) file write fh \_n \_tab "etiqueta’” _tab %12.0fc (r(N_1)) _tab %12.3fc (r(mu_1)) _tab %12.0fc (r(N_2)) _tab %12.3fc (r(mu_2)) _tab %12.3fc (dif') \_tab %12.3fc (r(t)) file write fh \_n \_tab \_tab \_tab %12.3fc (se_1’) _tab _tab %12.3fc (se\_2') \_tab %12.3fc (r(se)) \_tab %12.3fc (r(p)) local i=i’+1
}
file close fh
type descstats.txt
[/sourcecode]